


Much of the political world gasped this week when the latest New York Times/CBS News poll found President Obama’s approval rating down sharply over the last month, dropping from 50% to 41% for no apparent reason. Though the same poll still showed Obama leading the Republican field, the nine-point drop in support was one of the largest drops any president has seen in the poll in the last 15 years, and reversed a general positive trend for the president.
In many circles, Democrats had to resist the urge to panic, while Republicans started walking with a spring in their step. Both, however, were asking the same question: what happened to cause such a decline?
The answer, in all likelihood, is nothing.
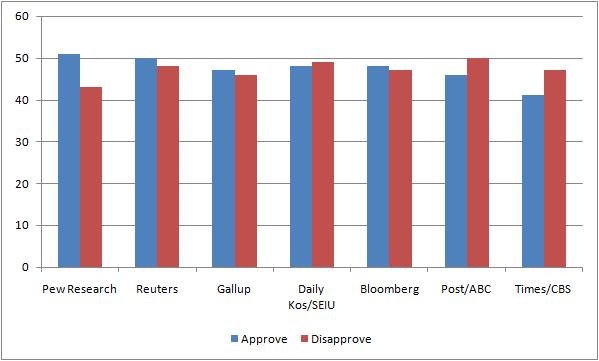
As of this morning, I’ve seen seven national polls released this week: Pew Research Center, Reuters, Gallup, Daily Kos/SEIU, Bloomberg, Washington Post/ABC News, and the aforementioned New York Times/CBS News survey. I put together a chart showing Obama’s approval/disapproval in each of the seven:
As you’ll notice, there’s a fair amount of variety here. The president’s approval rating varies from 51% to 41%, while his disapproval rating goes from 43% to 50%.
Average these seven polls together, and what do you get? 47.3% approval, 47.1 disapproval. As Ezra Klein noted this morning, when it comes to “the mystery of Obama’s plummeting poll numbers, I’m not yet convinced there’s any mystery here at all…. [U]ntil more polls show a significant drop for the president, I’m inclined to write this off as noise.” I agree. If all seven of this week’s polls showed the same thing, it’d be far easier to take the results seriously, but that’s just not the case. One poll found a sharp drop in the president’s support, a few polls found a steady increase. Those looking for reasons to celebrate or mourn will have to look elsewhere. I’d just add one more relevant detail: it’s mid-March. I’d be lying if I said I ignored the polls at this stage, but the election is 237 days away. At various stages, the various candidates will go up and down in the coming months, trading leads and seeing peaks and valleys in their levels of support. There’s just no reason for one poll to be taken too seriously, no matter what it says.
The place for in-depth analysis, commentary and informed perspectives. Recommended

