


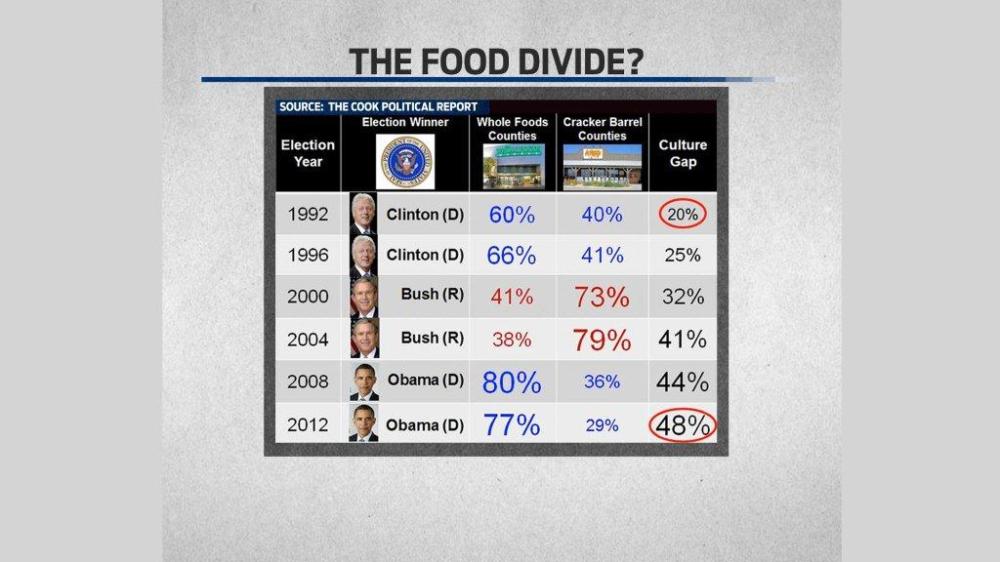
David Wasserman, the Cook Political Report’s House Editor, made headlines when he called the 2012 election a battle between the Whole Foods shoppers and Cracker Barrel patrons. Now he has the post-election data to back up his claim – and proof that the country’s partisan divide when it comes to spending habits is wider than ever.
According to Wasserman’s data, 77% of counties that contain a Whole Foods went for President Obama last week. That’s on par with the 2008 election, when a record high of 80% of Whole Foods counties voted for Obama, up considerably from previous record holder Bill Clinton’s 66 percent in 1996. Less than a third of Cracker Barrel counties went for President Obama this time around – even fewer than in 2008 (when most of those counties had a Whole Foods, too), and far less than the 40% margins that came in Bill Clinton’s two presidential runs.
What does it all mean? The gap between the Whole Foods counties and Cracker Barrel counties–Democrats and the Republicans–is wider than ever.
While Wasserman’s data isn’t quite a science, it’s a pretty good indicator of a county’s political climate. Whole Foods tend to spring up in more affluent neighborhoods in cities or suburbs; Cracker Barrels tend to occupy real estate off major highways. In August The LA Times highlighted a study from Scarborough Research on the “Politics of Eating Out.”
The larger dots represent the restaurant’s popularity. The higher the restaurant is on the chart, the more likely its patrons are to vote. And to the left we have the democratic-leaning patrons; to the right, the likely Republicans. Sure enough, there are Wasserman’s “Whole Foods voters,” the high-turnout Dems on the upper left, and the “Cracker Barrel voters” on the upper right.
This consumer data is mined by political operatives in a process called “microtargeting” used to get out the base and identify potential supporters. And it’s not just for food. Want to get the most bang for your buck on an ad for a Republican Senate candidate? You can target ultra-conservatives by advertising on PBS’s “Antiques Roadshow,” or target swing voters with a 30-second ad on FX’s “Sons of Anarchy.” For Dems, Comedy Central’s “The Daily Show with Jon Stewart” and “The Colbert Report” are prime territory, with “30 Rock” and “Modern Family” close behind. Even everyday name brands show a partisan lean in patronage: a June study by Buyology Inc. shows that Democrats prefer to drive Jeeps, watch the NFL, drink coffee from Starbucks and play Wii. Republicans choose BMW, Major League Baseball, Dunkin’ Donuts and XBOX. Of course, the real battle in every election boils down to the swing voters – maybe you’d think of them as the Wendy’s frosty enthusiasts, fans of “The Deadliest Catch” or “It’s Always Sunny in Philadelphia,” or Coca-Cola drinkers and Google web users. Maybe they’re the Publix grocery shoppers in Florida or the Acme supermarket goers in Ohio. So in more ways than one, the old adage holds true: You are what you eat.
Erin Delmore Recommended
![]()

![]()