


I’ve been known to publish a few charts and graphs on the debt from time to time, but this latest gem from the Center on Budget and Policy Priorities is especially important.
We talked earlier this week about a policy detail much of the political establishment chooses to overlook: the fact that policymakers have already adopted a series of measures that will sharply reduce growth in the national debt. Indeed, just since the start of fiscal year 2011, President Obama has signed $2.4 trillion of debt reduction into law. If one includes the projected savings from the Affordable Care Act, that total is even higher.
For the right, which ironically was responsible for creating a fiscal mess during the Bush/Cheney era but which now inexplicably claims the high ground, the progress isn’t good enough. We need more austerity, conservatives argue, to address the “debt crisis.”
Of course, there is no debt crisis right now — the U.S. can borrow as much as it wants, cheaply and easily — and the CBPP’s report reminds us that there’s no real crisis on the horizon, either.
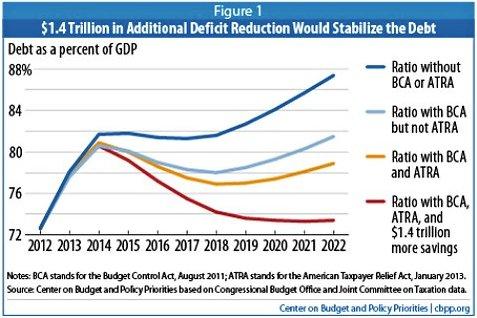
See the orange line in the image? That shows the debt trajectory under the status quo — which includes the Budget Control Act approved in 2011 and the American Taxpayer Relief Act (the bipartisan Biden/McConnell fiscal deal) signed into law last week. Under this scenario, the debt, as a percentage of the economy, will dip through the end of the decade before climbing again.
Which is why that red line in the image is interesting.
As the CBPP sees it, if policymakers agreed to about $1.4 trillion in additional debt reduction, the country would be on a “sustainable path.” This does not, to answer your next question, include the sequestration savings, which are due to kick in next month.
In other words, for all the handwringing, if policymakers can agree to a balanced deal to replace the sequester sometime over the next seven weeks, they’ll practically be done with debt reduction for a long time. As Paul Krugman explained, “[T]he larger message here is surely that for the next decade, the debt outlook actually doesn’t look all that bad.” True, there are projected problems further down the road, mainly because of the continuing effects of an aging population. But it still comes as something of a shock to realize that at this point reasonable projections do not, repeat do not, show anything resembling the runaway deficit crisis that is a staple of almost everything you hear, including supposedly objective news reporting. So you heard it here first: while you weren’t looking, and the deficit scolds were doing their scolding, the deficit problem (such as it was) was being mostly solved. Can we now start talking about unemployment? That sounds good to me.
Steve Benen is a producer for "The Rachel Maddow Show," the editor of MaddowBlog and an MS NOW political contributor. He's also the bestselling author of "Ministry of Truth: Democracy, Reality, and the Republicans' War on the Recent Past." Recommended

