


According to the latest NBC News|SurveyMonkey Weekly Election Tracking poll, former Secretary of State Hillary Clinton is now only slightly ahead of businessman Donald Trump in a general election match-up among registered voters, 47 percent to 45 percent.
Vermont Senator Bernie Sanders, however, continues to perform much better against the presumptive Republican nominee than Clinton and is currently beating him by a full 12 points, 52 percent to 40 percent. Why does Sanders do better than Clinton against Trump? This is an important question that will have implications for Clinton’s campaign if she becomes the presumptive nominee and looks to win over voters in the coming months.


Over the last four weeks, the NBC News|SurveyMonkey Weekly Election Tracking Poll asked all respondents who they would support in November with two separate head-to-head scenarios. This data was then analyzed to determine who the consistent Trump supporters were (those who chose Trump in both match-up questions) compared to who the consistent Democratic voters were (those who would support either Democratic candidate – Sanders or Clinton – against Trump).
The focus of this analysis is voters who support Sanders, but not Clinton, against Trump. These are the voters who should be the easiest for Clinton to win over, and several of them probably will end up supporting her, if history is any guide.
The combined sample size of those weeks for those who support Sanders but not Clinton against Trump is a huge number—2,927 adults who say they are registered to vote. The reason the number is so large is that the overall sample of the four weeks of tracking results combined is 51,078 adults who say they are registered to vote.
Demographically, voters who would support Sanders but not Clinton are mostly white (76 percent) and a majority (54 percent) are men. These voters are younger than the other voting groups—59 percent are under 45 years old. This follows a trend seen in NBC News Exit Poll results during the primary season; younger voters were more likely to vote for Sanders and older voters were more likely to vote for Clinton.

While the demographic composition of this group is predictable, a basic comparison of ideological and partisan breakdowns of these voting groups is more revealing. Unsurprisingly, consistent Trump supporters are mostly Republicans and consistent Democratic supporters are mostly Democrats. This is consistent with several studies that show partisanship is a strong predictor of vote choice. A similar number of consistent Trump supporters and consistent Democratic supporters identify as Independents – 11 percent and 12 percent, respectively.

Interestingly, those who would vote for Sanders but not Clinton against Trump are evenly split when it comes to party identification – 35 percent identify as Republicans, 33 percent as Independents and 31 percent as Democrats. This is not particularly good news for Clinton as more than two-thirds of those who would support Sanders but not Clinton do not identify as Democrats. If the 31 percent who identify as Democrats vote in the general election, they will be much more likely to vote Democrat than Republican. But the likelihood that the 33 percent of Independents in this group would vote Democrat is unknown. And it is hard to believe that a large number of the 35 percent who identify as Republicans would be persuaded to support the Democratic nominee.
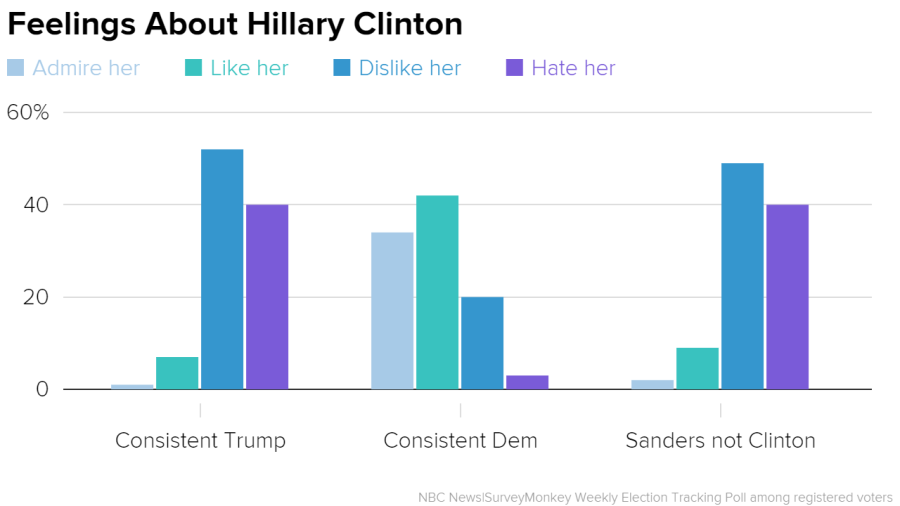
Throughout the Democratic primary race, Sanders has repeatedly said he wants to move the party to the left and has openly challenged the party to adopt his left-leaning policy platform in their July convention. This has led many pundits to suggest that very liberal voters would abandon the Democratic Party in November and it leads to the question of whether Sanders but not Clinton voters are mainly left-leaning liberals. Surprisingly, 57 percent of Sanders but not Clinton voters identify as moderates. This is a stark and surprising finding. It means that Sanders’ margins over Trump are being driven by large numbers of moderate voters. Feelings toward Clinton are also an important part of the results. A closer look at attitudinal differences confirms that voters have strong negative feelings toward Trump and Clinton. During the week of May 16 through May 22, the Weekly Election Tracking Poll asked about overall feelings and reasons for supporting Clinton or Trump. Voters who chose Sanders but not Clinton resembled consistent Trump supporters in their hatred of Clinton. Four in 10 said they hate her and another 49 percent said they dislike her. Among Trump’s base, 40 percent said they hate her, and 52 percent said they dislike her. These Clinton-hating Sanders voters weren’t exactly thrilled about Trump either, however. A strong majority—61 percent—said they either hate or dislike Trump. Apparently, they just don’t hate Trump as much as they hate Clinton. The data suggest Clinton will have a hard time winning over this group of Sanders supporters because of the reason they didn’t choose Clinton over Trump: opposition to Clinton. More than six in 10 Sanders but not Clinton supporters said the most important reason for their vote choice was because of opposition to her. This is far higher than either consistent partisan group’s reason for selecting their candidate: 32 percent of consistent Trump supporters picked him in opposition to Clinton and 34 percent of consistent Democrats picked Clinton in opposition to Trump. The notion that party-abandoning Democrats are the reason Sanders does better against Trump is just not supported by the data. The analysis shows they are moderate, non-partisan voters who dislike both candidates but are most intense in their feelings about Clinton. This presents a real challenge for Clinton and provides some evidence that 2016 Democratic voters might not stay true to their party as they did in 2008. History may repeat itself and Clinton may find a way to bring these voters to her side, but the task is potentially taller.
Stephanie Psyllos
Hannah Hartig
Susan Del Percio is a Republican strategist and a political analyst for MS NOW. Recommended


![]()
![]()