


The percentage of American workers who are union members again dropped in 2012, according to a new report from the Bureau of Labor Statistics. According to the BLS Union Members Summary, overall union density fell from 11.8% to 11.3%. In the public sector, 35.9% of workers are represented by unions, as opposed to 6.6% in the private sector.
“Working women and men urgently need a voice on the job today, but the sad truth is that it has become more difficult for them to have one, as today’s figures on union membership demonstrate,” replied AFL-CIO President Richard Trumka in a statement.
According to data compiled by Cornell University’s School of Industrial and Labor Relations [PDF], union density in the United States peaked around 1954, before declining sharply over the following two decades. Excluding a brief upturn in the late seventies, the percentage of union members in the American workforce has steadily declined ever since.
The seventies also happen to be when American wages stopped their upward climb. Wages, adjusted to the consumer price index, have stagnated for the past forty years. When inflation is also factored in, they have been in free fall. Meanwhile, according to the new BLS numbers, there remains a significant wage gap between union members and non-union workers: Median weekly earnings for union members came to $943, versus $742 for everyone else.
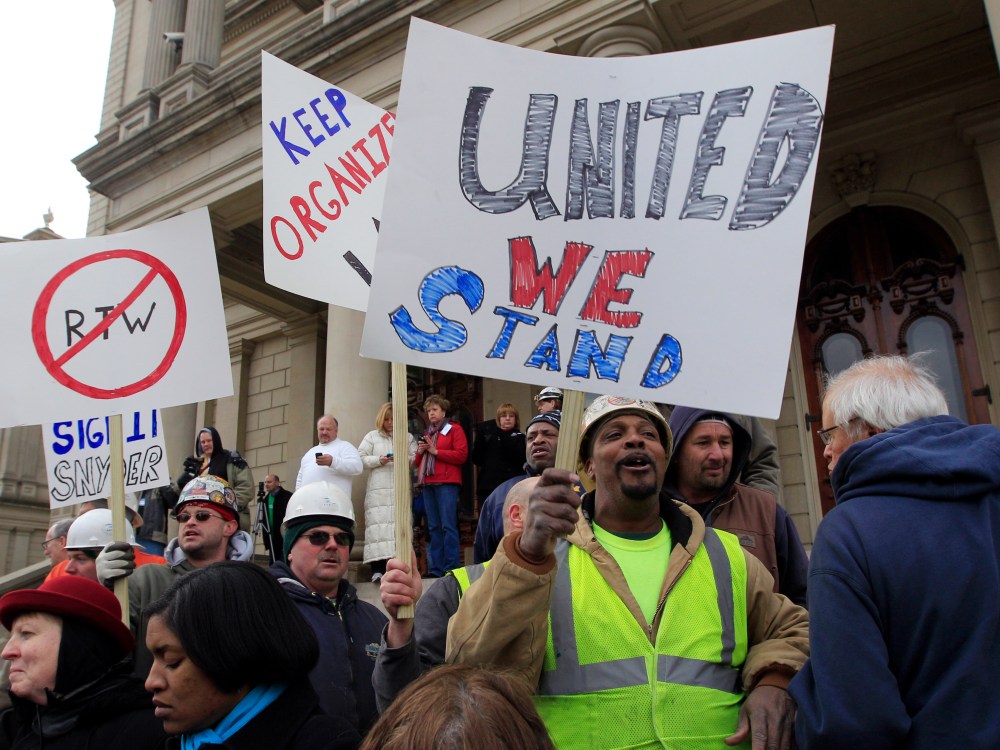
Part of the reason for organized labor’s decline has been a sustained political assault, which heated up in 2012 when anti-labor forces successfully passed an anti-union “right-to-work” law through the Michigan legislature. Unions were also hit by the year’s widespread public sector layoffs, as state and local governments shed labor costs in response to massive budget shortfalls. Trumka insisted that all hope is not lost, however. “What will define the labor movement of the future, however, is not assaults or the changing economy, but how working people come together to respond to them,” he said. “We enter 2013 with our eyes open and understand that these challenges offer real opportunities for working people to reshape the future. “
Ned Resnikoff is an urban policy analyst, researcher, writer, and editor. His byline has appeared in a variety of publications, including the New York Times, San Francisco Chronicle, Dissent, and The Nation. He writes the newsletter Public Comment, which can be found at publiccomment.blog. Recommended

